Graph of Expected Maximum Deviation from Mean of a Normally Distributed Variable with Increasing Number of Samples
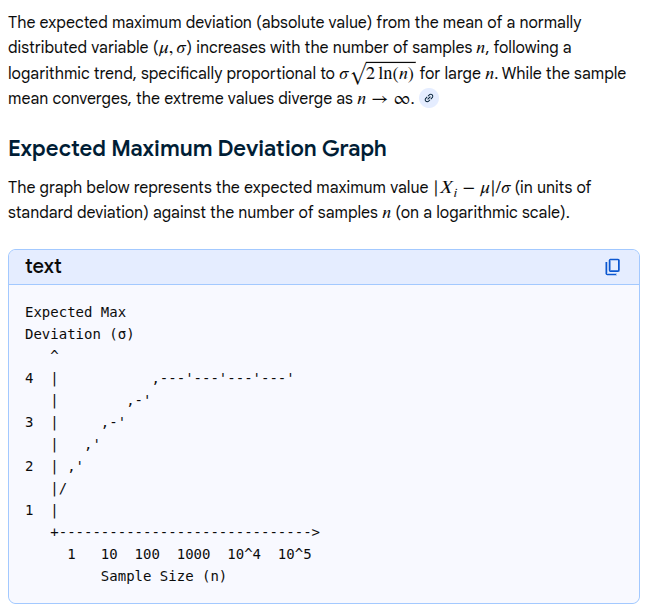
- Grok: graph the expected maximum deviation from mean of a normally distributed variable increasing number of samples – more or less same results.
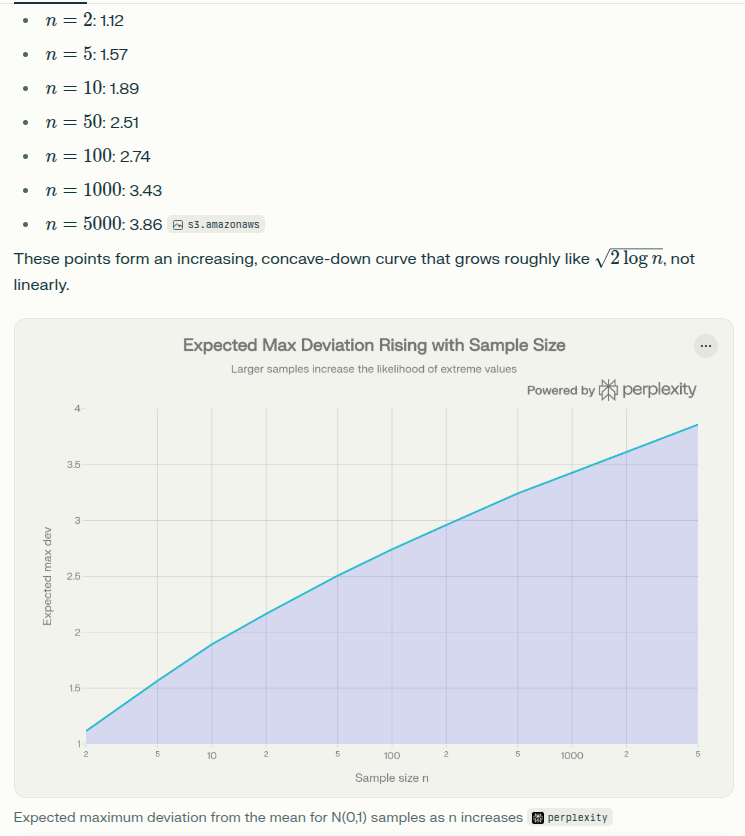
- Perp: graph the expected maximum deviation from mean of a normally distributed variable increasing number of samples – mostly same but with good graph