Business
Corbett Report-Meet Goldman Sachs, the Vampire Squid-Blue Ridge Corporation Stock Certificate
Research Links
Goldman Sachs in its present form was rooted in a fraud called the "Blue Ridge Corporation" and many called the depression of the 1930s "The Blue Ridge depression"
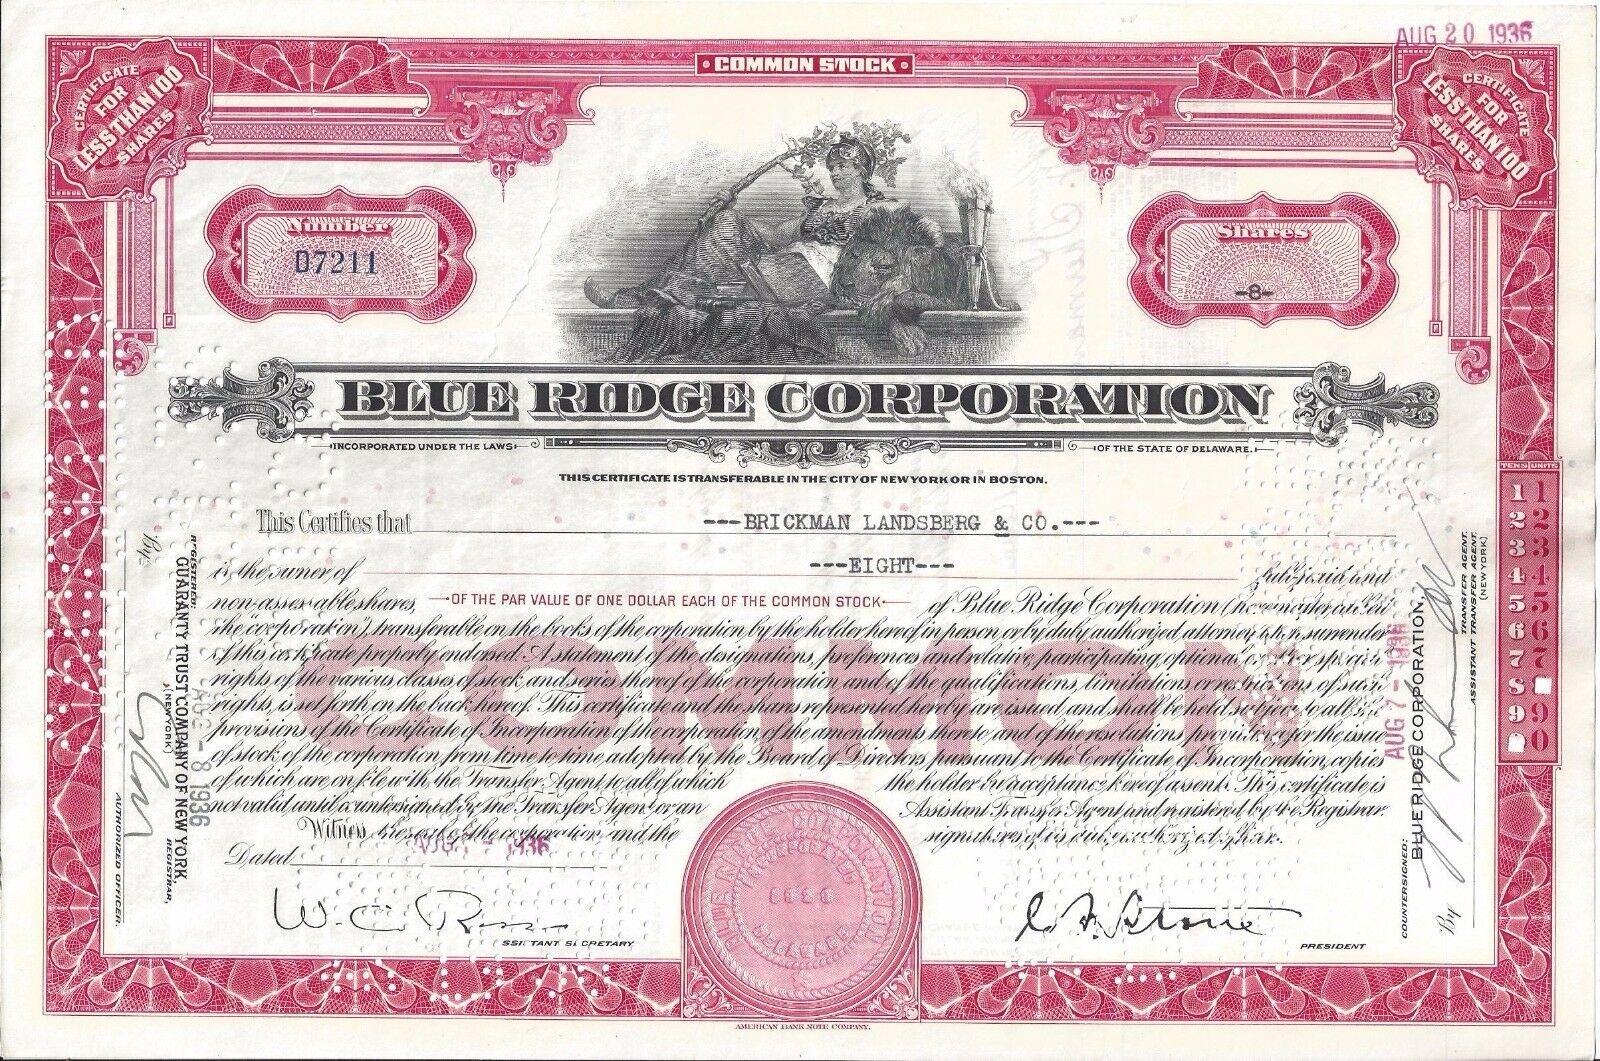
After listening to this podcast I purchased this canceled stock certificate on ebay.
Business
Your Very First Options Trade
Notes
- The standard old options expire every third friday of the month. There are weekly options that expire every friday too. Many sites when talking about options will mention only the more limited version of 3rd fridays.
- Expiration on friday includes after hour trading. So 4pm is not the magic time.
Research Links
Business
Double Dividend Strategy Combining Options Selling with High Dividend Stocks
Covered Calls Table features over 25 covered calls trades which we update throughout each reading day. Two trades that caught our attention this week are for blue chip dividend stocks Boeing, (BA), and Intel, (INTC).
Research Links
Business
Stock Options Mathematical Theory
This is my note taking page for stock options. The distributions are hard for me to visualize in my current state of ignorance.
Research Links
- Google: probability theory of puts and calls
- Introduction to Options Pricing Theory – Simone Calogero – Chalmers University of Technology
- The Extensive and Essential Options Trading Guide


Business
Stockcharts.com Relative Rotation Graph

JdK RS-Ratio versus JdK RS-Momentum plot
JdK RS-Ratio
The JdK RS-Ratio is a normalized measure of trend in relative strength. So be careful it is therefore not a measure of relative performance as such but it tries to pick up trends in relative performance end measure the strength of such a trend. The JdK RS-Ratio is the input on the horizontal axis on the RRG chart. A universe of stocks or sectors can be ranked based on the values of the JdK RS-Ratio, high values are good, low values are bad. Values over 100 indicate an up-trend in relative strength while values below 100 indicate a down-trend in relative strength.
JdK RS-Momentum
The JdK RS-Momentum line is a normalized measure of momentum/rate-of-change of the RS-Ratio line and is, just like the RS-Ratio line itself, comparable across a universe of instruments. As a momentum / rate-of-change indicator is always leading the underlying (of which the rate-of-change is measured) you will note that the JdK RS-Momentum line will cross the 100-level upward when the RS-Ratio line has formed a trough and is starting to move up. JdK RS-Momentum will cross the 100-level downward when the RS-Ratio line has formed a peak and is starting to move downward.
JdK == Julius de Kempenaer
"RRG charts show you the relative strength and momentum for a group of stocks. Stocks with strong relative strength and momentum appear in the green Leading quadrant. As relative momentum fades, they typically move into the yellow Weakening quadrant. If relative strength then fades, they move into the red Lagging quadrant. Finally, when momentum starts to pick up again, they shift into the blue Improving quadrant."
Research Links