Books
The Lost Book of Archimedes : Documentary on the Lost Manuscript of the Mathematical Genius
The Archimedes palimpsest is a 10th century copy of his work called "The Method". I would like some day to read it.
Research Links
The Archimedes palimpsest is a 10th century copy of his work called "The Method". I would like some day to read it.
Research Links
This code was originally thought to be unbreakable. You use a key such as PASSWORD. Each Letter in your message is encoded by placing
PASSWORDPASSWORDPASSWORD
THISISATESTOFTHECODE
Each letter is encoded by selecting the corresponding column from the key letter above your message letter. The obvious failing is that after a bit you run out of key and start repeating. This makes the code subject to frequency analysis. Of course if your key word is a phrase of some length you might be able to avoid that.
It is interesting that only about 150 years ago this would be considered unbreakable.
![300px-vigenc3a8re_square_shading[1]](http://www.amarketplaceofideas.com/wp-content/uploads/2015/09/300px-vigenc3a8re_square_shading1.jpg)
Research Links
matplotlib is a plotting library for the Python programming language and its NumPy numerical mathematics extension. It provides an object-oriented API for embedding plots into applications using general-purposeGUI toolkits like wxPython, Qt, or GTK+. There is also a procedural "pylab" interface based on a state machine (like OpenGL), designed to closely resemble that of MATLAB. SciPy makes use of matplotlib.
Research Links

Prime numbers on a Sacks spiral. The prime numbers are depicted as dots.
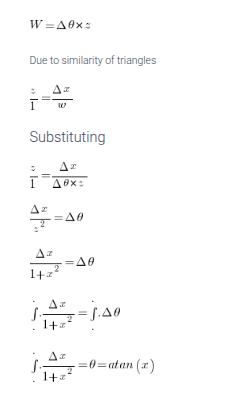
The line with the arrow was discovered by Euler. x2 + x + 41,
Research Links
Used it a lot at UFSC. These are my notes on the usage of GnuPlot with examples.
Research Links

You can download the file used in the example below and follow along: Processed_P1-Data.csv
Point Gnuplot to the correct directory to find the file full of data that you want to plot
The button with the folder icon and ChDir is what you want:

Set up GnuPlot to recognize comma as the field separator
set datafile separator ","
This needs to match the field separator in your file. My file has commas. Watch out for excel files that export sometimes with only a CR and no LF character. This will drive you crazy because it looks just fine when you look at the file with a text editor unless you are using something like NotePad++. Then you will see it. You need a right handed karate chopped n & r. That would be \n\r.
Set the title of the plot
Setting up X axis to be log scale
Use the following command to select a log scale on X:
When you need to switch back out of this mode:
unset logscale x
It appears they do not have an explicit command for "linear" mode.
Setting up the X and Y tics
Example:
     set xtics 0,.5,10
     set xtics add ("Pi" 3.14159)
This will automatically generate tic marks every 0.5 along x, but will also add an explicit labeled tic mark at pi
Setting up the X and Y minor tics
set mxtics 2 # this divides the interval between major tics by 2 and thus you get 1 tic in between major tics
Setting up axis formatting
Example:
set format y "%4.0s" – this gives 4 integer with nothing after the decimal point
Plotting with continuous lines
with line
Example:
plot "Current-Voltage-Power.csv" using 1:3 with line lt-1 lw 3,"Current-Voltage-Power.csv" using 1:7 with line lt-1 lw 3 axes x1y2,"Current-Voltage-Power.csv" using 1:6 with line lt-1 lw 3
Setting the range to avoid taking log(0) and getting an error
When you try to plot a Log(X) axis you will see the following error
x range must be greater than 0 for log scale
If you have not already done so set your X range so it does not include zero with: set xrange[1e-10:1e-4]
or whatever you like for the first value just make it >0.
Plotting Log(X) axis values correctly Without this statement your X axis is labeled: 00000 00000 00000 .00001 .00010 etc and what you want is shown below.
If you use a log scale you will probably also want to format the log axis value labeling.
set logscale x 10
set format x '10^{%L}'  #<- enhanced text.
 ​
​
At this point the plot function should probably start working
plot "Processed_P1-Data.csv" using 4:8
If you want more than one plot on the same graph
In order to plot multiple lines in a single plot, simply put them in a single plot command like
plot 'AAA' u 1:2, 'BBB' u 1:2
If you want lines instead of only data points use:
plot "Processed_P1-Data.csv" using 2:3 with lines
Setting line color: You need this when GNUPLOT uses yellow as it is hard to see
set style line 6 linecolor rgb "blue"
How to turn off the dataset legend that takes up so much room in the plot area

Set the plot size
set terminal wxt size 800,600
Running a Script file
load "scriptname"
Plot Decimated data – 1 point for every X


 ​
​